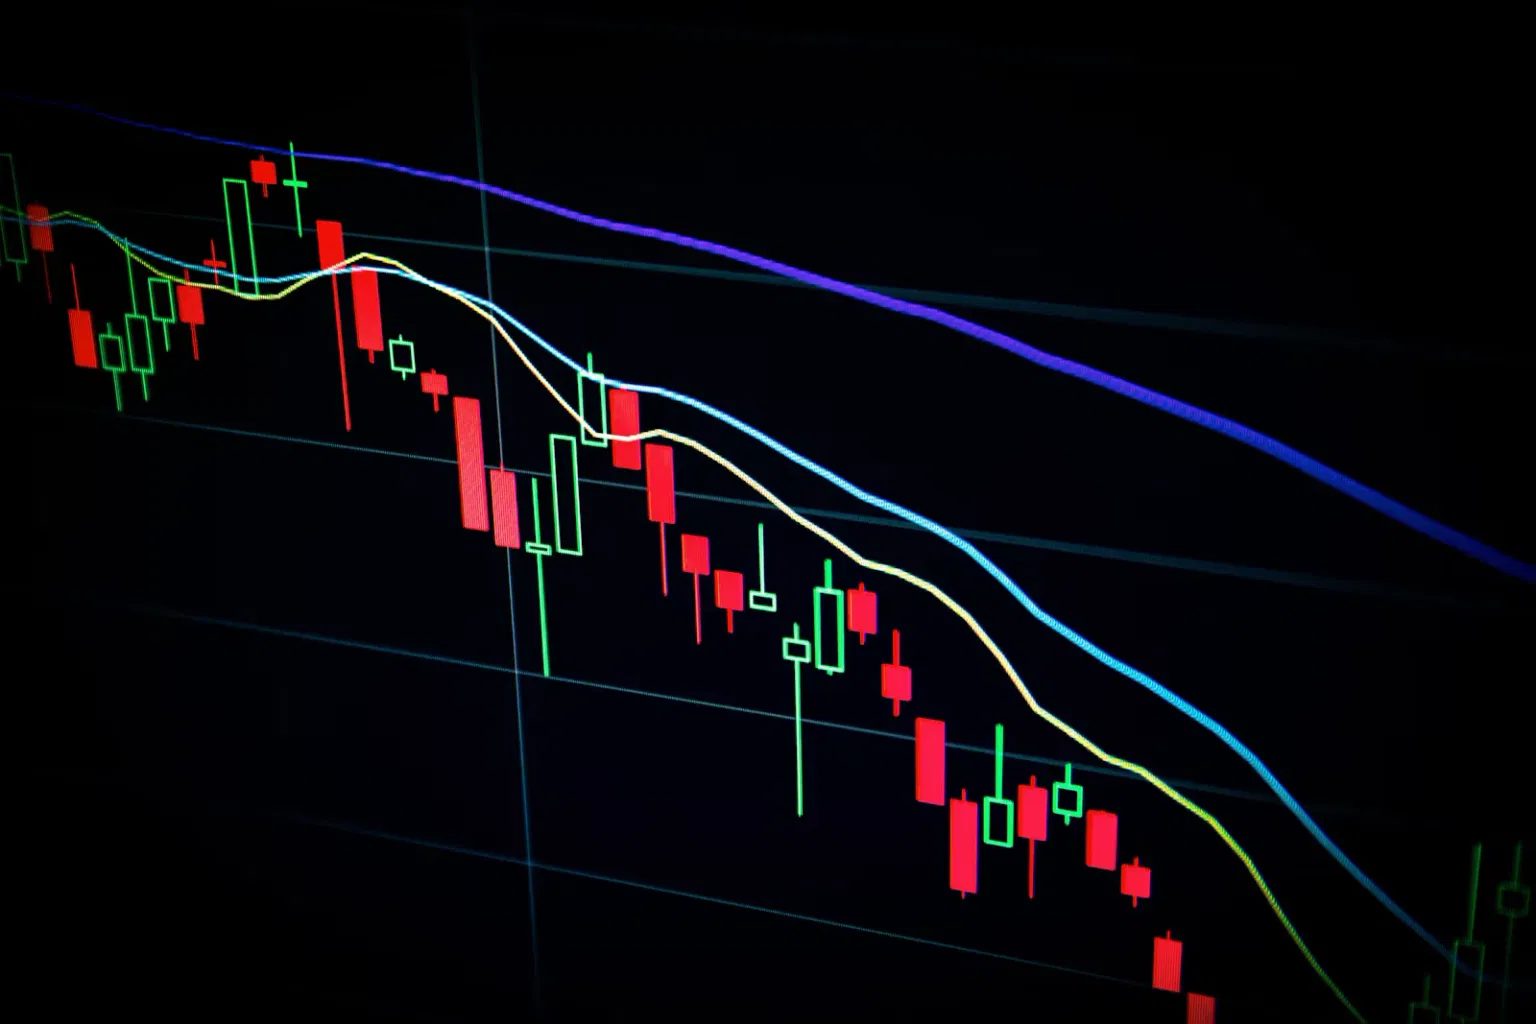
Few questions rattle investors quite like "should I sell now?" — and that question has grown louder after a rocky September on Wall Street. The Dow Jones Industrial Average slid more than 4% for the month while the S&P 500 slipped about half a percent, a pullback driven less by a single shock than by a slow squeeze: bond yields climbing to multi-year highs, a wobble in high-flying technology shares, and renewed geopolitical tensions. Even so, the Nasdaq actually finished September in positive territory, a reminder that beneath the headline losses, the market was rotating rather than collapsing. For long-term investors, the real challenge is not predicting the next move — it is deciding how to respond to this one.
What's Behind the Sell-Off: Rising Yields Squeeze Stocks
The clearest culprit behind September's slide is the bond market. The 30-year Treasury yield climbed toward 5.4%, and the Japanese 10-year government bond yield hit its highest level in three decades, according to coverage from The Wall Street Journal and market data tracked across the month. When risk-free government bonds offer higher payouts, the valuations of stocks — particularly expensive growth and technology names — come under pressure.
A second, related factor was supply. On September 9, stocks finished lower for a third straight session as Treasury yields rose to their highest level in nearly three years, with investors weighing the scale of a Treasury Department buyback operation, Investopedia reported. Reuters later noted that two-year yields initially fell on news that markets were bracing for a possible Federal Reserve interest-rate hike the following month.
The pressure was not limited to rates. Weakness in technology stocks, mixed economic data, and geopolitical headlines — including new Middle East strikes that sent oil prices surging — all contributed, according to a September 1 Wall Street Journal live blog. The result was a market that pulled back from record highs even as it remained broadly higher for the year.
A Timeline of September's Slide
September's decline unfolded in stages rather than in a single panic:
- September 1: Oil surged after new Middle East strikes, and the Nasdaq fell as the Japanese 10-year yield reached a three-decade high, The Wall Street Journal reported.
- September 9: Stocks closed lower for a third consecutive day as Treasury yields hit their highest level in nearly three years, per Investopedia's daily market update.
- September 13: Yahoo Finance published an analysis arguing that stock market sell-offs are painful but that history favors investors who keep buying regularly into index funds.
- September 30: Reuters reported that bonds posted their worst month in years as stocks declined for the month, with CNBC tallying the Dow down 4.3% and the S&P 500 down 0.5%, while the Nasdaq rose 1.9%.
This was not even the market's first scare of 2026. U.S. Bank noted the S&P 500 fell about 8% between February 27 and March before recovering — a reminder that pullbacks are a recurring feature of investing, not a rare disaster.
What History Says About Sell-Offs and Recoveries
History offers a surprisingly consistent lesson: sell-offs happen often, and they end. Since 1950, the S&P 500 has weathered roughly 38 corrections of 10% or more — and every single one eventually recovered, according to Plus500's analysis of historical market data. The average correction has recovered within three to eight months, while more severe bear markets have typically taken one to two years or longer.
The recovery math gets even more encouraging at smaller scale. Invesco found that a 5% to 10% downturn has recovered in about three months on average, while a 10% to 20% correction has taken about eight months. Capital Group's research puts the average bear market since 1950 at about 12 months, compared with bull markets that have lasted more than five times as long.
Perhaps the most striking statistic comes from Hartford Funds: one year after each of the S&P 500's ten worst single-day drops, the index delivered double-digit positive returns in all but one instance. The pattern behind these numbers is clear — the investors who are hurt most by a sell-off are usually the ones who sell during it and lock in losses, while those who stay invested tend to participate in the recovery.
What Financial Advisers Are Telling Investors Right Now
The advice from major brokerages and financial institutions is remarkably consistent: do not panic, and do not try to time the market.
Fidelity's guidance on market corrections is blunt — investors who sell in an attempt to head off further losses "risk locking in potential losses and often miss out on the market's subsequent recovery." Chase echoes the point, advising investors to maintain a long-term perspective, stay diversified, and follow a predetermined investment plan rather than reacting to headlines.
On the strategy front, the recurring recommendation is dollar-cost averaging. Seeking Alpha's September analysis concluded that most investors should "continue to dollar-cost average into low cost S&P 500 ETFs or funds," which removes the guesswork of timing the market. Yahoo Finance made a similar case, pointing to the Vanguard S&P 500 ETF (VOO) as a simple vehicle for regular, automatic investing.
For investors who lose sleep over volatility, Charles Schwab offers practical guardrails: build cash reserves so you are not forced to sell investments during a downturn, stay invested, and resist the temptation to time the market. The Financial Times put it even more simply in its advice for shaky markets — hold your nerve, because trying to time the market risks missing the handful of critical days that drive long-term returns.
Where Things Stand and What's Next
Despite September's turbulence, the market remains firmly higher for the year. Through September 30, the S&P 500 was up 11.8%, the Nasdaq Composite up 15.6%, and the Dow up 5.9%, according to Chase. Yet beneath that surface, the rotation has been severe: Nasdaq reported that 83% of its members were trading more than 10% below their 52-week highs, and 42% were down more than 20%.
Looking ahead, the key variables to watch are the same ones that drove September's slide: the path of bond yields, the Federal Reserve's next decision on interest rates, and whether technology earnings can justify still-elevated valuations. For most investors, though, the playbook does not change with the news cycle. A diversified portfolio, a regular contribution schedule, and the discipline to stay invested through the noise remain the most reliable ways to turn a sell-off from a source of fear into a long-term opportunity.
The Bottom Line: Key Points to Remember
- September's sell-off was driven mainly by rising bond yields, tech weakness, and geopolitical tensions — not by a fundamental collapse in corporate earnings.
- The market stayed positive for the year: the S&P 500 was up 11.8% and the Nasdaq up 15.6% through September 30.
- History shows corrections recover in months on average, and every correction since 1950 has eventually recovered.
- Financial advisers consistently recommend staying invested, diversifying, and dollar-cost averaging rather than selling in a panic.
- The biggest risk in a sell-off is locking in losses and missing the recovery.